Dive into the National Marine Ecosystem Status indicator for ocean acidification

Marine ecosystems provide food, jobs, security, well-being, and other services to millions of people across the U.S. and they are facing increasingly complex challenges, including ocean acidification. Tracking the status and trends of these ecosystems is critically important to understand how they are changing and identify potential issues.
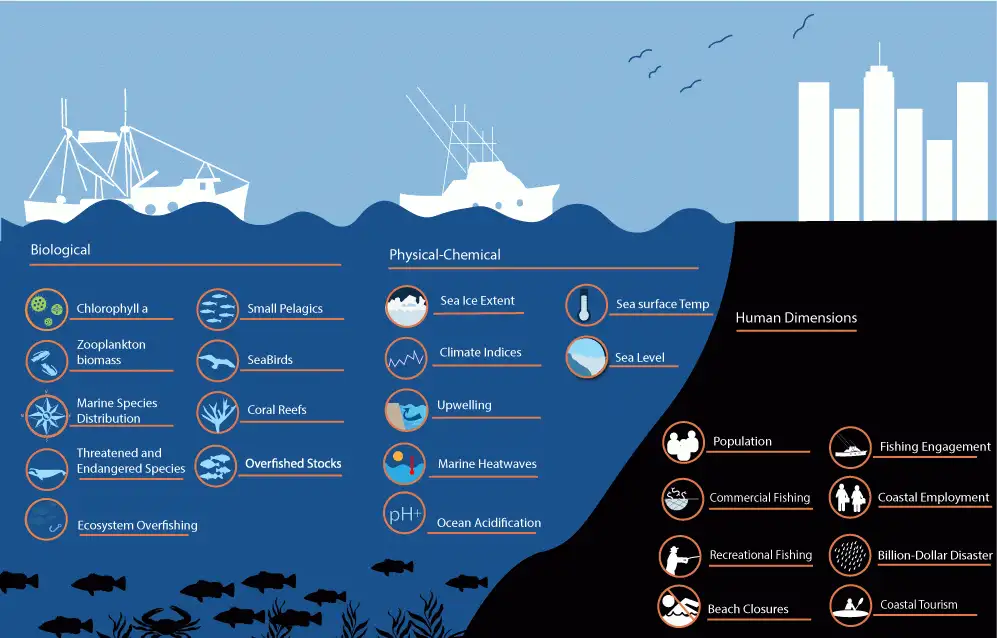
NOAA’s National Marine Ecosystem Status website provides snapshots of major marine and Great Lakes ecosystem indicators, capturing both the status and trends of eight U.S. ecosystem regions and overall national status. The ocean acidification indicator dashboard uses long-term ocean observing data to provide snapshots on ocean chemistry.
What are the ocean acidification indicators?

Indicators are specific, observable data that give us information about the health of an ocean ecosystem. To observe ocean acidification trends, the indicators provide a quantitative picture of ocean chemistry. The NaMES dashboard aggregates publicly available data and is updated annually.
One of the most valuable components of this dashboard is the ability to see the trends and variability. The ocean acidification indicator dashboard displays three critical sea surface components at 11 set locations across the seven LMEs. They are partial pressure of carbon dioxide (pCO2), surface water acidity (pH) and aragonite saturation state (Ωar), which is a measure of the availability of an important mineral building block in seawater. The data show how much carbon dioxide is in the upper ocean and over time and trends in ocean acidification. The indicators provide a snapshot of the status of ocean acidification at any point in time as well as the trend over time
What is this dashboard and why use it?
OAP commits to providing easily-accessible ocean and coastal acidification data people can use. One tool for tracking and monitoring the nation’s seven large marine ecosystems (LMEs) is the National Marine Ecosystem Status website, or NaMES, dashboard. The NaMES dashboard aggregates publicly available data and is updated annually. This dashboard is a great starting point for people who want to know more about the health of our ocean since it provides a snapshot of the health of marine ecosystems, including ocean acidification indicators. Ocean acidification is only one theme of the 24 indicators provided.
Each time-series dataset shows seasonal and multi-year changes in a specific region over several decades. Collectively, these data show where ocean chemistry changed fastest from historical values.
What are the ocean acidification indicators on the NaMES dashboard?
- Sea Surface pCO2
The sea surface partial pressure of carbon dioxide, known as pCO2, indicates how much dissolved carbon dioxide is present in seawater. When sea surface pCO2 is less than what is in the atmosphere, seawater tends to take up atmospheric CO2 like a sponge. When sea surface pCO2 is greater than atmospheric pCO2, seawater tends to release CO2 to the atmosphere. The 2024 global average atmospheric pCO2 was 422.7 ppm (NOAA) and the ocean is in near equilibrium.
- Sea Surface pH
Sea surface pH measures the acidity of seawater. We measure pH on a scale of 0-14, with values above 7 commonly called “basic” and values below 7 called “acidic”. A shift in pH to a lower value reflects an increase in acidity. Changes in the amount of dissolved carbon dioxide in seawater alter its pH. In turn, pH is a logarithmic scale so small changes in pH mean big changes in acidity. While the ocean itself is not acidic with a pH typically near 8, small decreases in pH can affect marine life.
- Sea Surface Ωar
Aragonite is a calcium carbonate mineral and a building block for shells and skeletons of some marine life like shellfish, some plankton, corals and hard parts of other marine life. Sea surface Ωar, or “omega-aragonite”, indicates how suitable conditions are for this mineral to form or dissolve. When Ωar is above 1, aragonite can form or stay intact. When Ωar is below 1, aragonite will dissolve and become less available for building shells and skeletons. Species have different thresholds for how saturated these minerals need to be before posing biological challenges.
How to use this dashboard
The NaMES dashboard has two resources we recommend using to learn more including a “How to use this website” resource and a brief video tour of the dashboard.
Click on the indicator plots for a short description of the time series, a plain language description of the indicator and the data source.
Note the video mentions gauge plots that are not visible for the ocean acidification dashboard for clarity.
Reading the graphs
The time series plots describe and show the changes in each indicator over time and show at least 10 years of data. Each plot includes horizontal lines that indicate the median (middle) value of that indicator, as well as the 10th and 90th percentiles calculated for the entire timeline. This indicates the range where most measurements fall on the scale.
The two symbols located to the right of each plot describe how recent values (within the last five years) of an indicator compare against the longer timeline.
A black circle shows if the indicator's average value over the last five years is:
- Above the high range of historical values (90th percentile) (plus sign).
- Below the low range of historical values (10th percentile) (minus sign).
- Within the usual range of historical values (between the 10th and 90th percentiles) (solid circle).
The arrow shows the trend of the indicator over the last five years (2019-2024).
- An upward arrow indicates a recent increase in the measure greater than one standard deviation. This means that the measure is likely to indicate a recent upward trend that deviates from the average.
- A downward arrow indicates shows a recent decrease in the measure greater than one standard deviation. This means that the measure is likely to indicate a recent downward trend that deviates from the average.
- A left-right arrow means that there was no change or any recent change less than one standard deviation.
- There’s also a no-arrow option which indicates no significant trend.
What are the limitations of these indicators?
Each of the three ocean acidification indicators are at the sea surface. Sea surface data are helpful to understand atmosphere-ocean interactions and the environment of some surface-dwelling species. However, they do not shed much light on the conditions deeper in the ocean including mid-water or on the seafloor where so many ecologically, culturally, and economically important species live. Deeper waters usually contain more dissolved carbon dioxide (higher pCO2) and have a lower pH (more acidic) and omega aragonite (relatively mineral deficient).
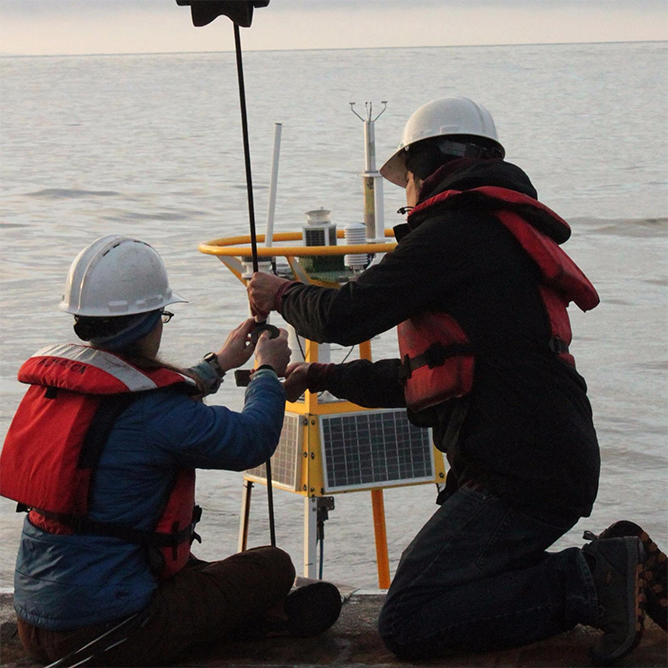
These three ocean acidification indicators are data collected through SOCAT, where measurements are taken from ships transiting across the ocean. While they enhance our data coverage over space and time, they do not include fixed stations that measure continuously and may not reflect all the variation that occurs at specific locations. Conversely, they have the advantage of potentially measuring conditions experienced by mobile marine species over their lifetime or even over a particular key period like reproductive or metamorphosis stages.

What are common trends in OA?

The NOAA dashboard confirms that while the severity varies, each region has at least one indicator showing increasing acidification. All monitored regions are tracked using the same three critical chemical metrics, giving a consistent view of the problem across the country.
Active Trend: Regions showing a significant increasing trend in pCO2 (e.g., Aleutian Islands and Gulf of America) have clear and actively worsening acidification. Here, all three of the indicators consistently move in the direction of increased acidity (i.e. pCO2 up, pH down, Ωar down).
Historically Acidified Status: Many regions (e.g., Gulf of Alaska, Northeast U.S., Southeast U.S.) show no significant recent trend in their pCO2. However, the current levels of pCO2 are high and pH and/or aragonite saturation are historically low. This likely means the conditions are currently stable, but they have already shifted into a persistent, more acidified state.
Other general trends
The rate and magnitude of recent change are highly region-specific. This variation is often due to local influences like freshwater input, upwelling events, and ocean circulation.
Colder water in high latitudes tends to have relatively large seasonal variability in pCO2, pH, and aragonite saturation due to the strong seasonal changes in temperature and circulation that occur in these regions.
Warm, low-latitude water tends to have relatively small seasonal variability in these measurements, making gradual changes in the baseline visible sooner. Additional variations can be caused by biological differences. Some examples are large phytoplankton or coccolithophore blooms occurring in different years or sites, or circulation changes like the El Nino Southern Oscillation (ENSO).
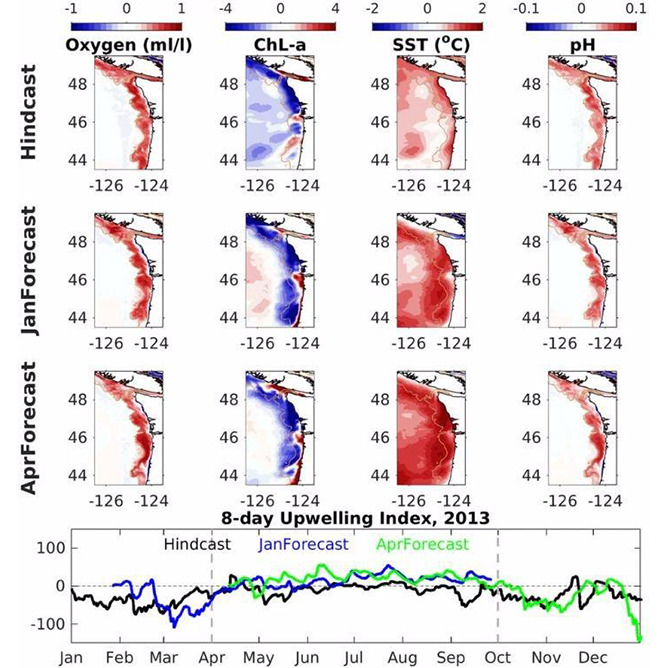
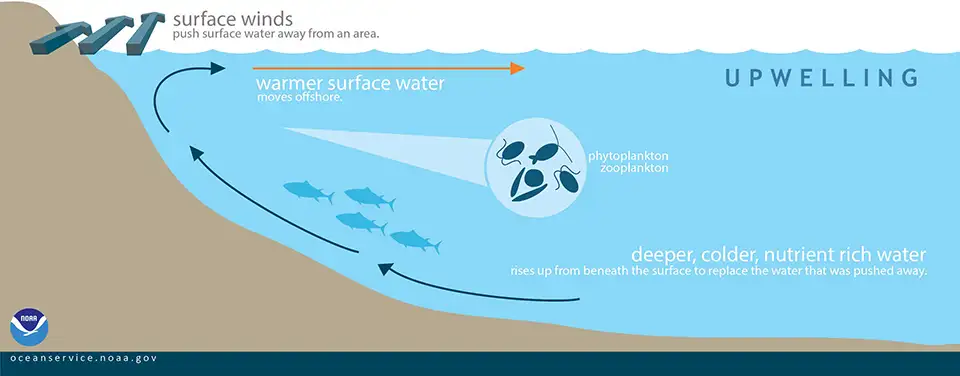
Upwelling areas like the California Current have seasonal upwelling that brings colder, more acidified water accompanied with high nutrients and lower oxygen. Upwelling both fuels natural phytoplankton blooms supporting marine ecosystems, but can also stress some marine life. Recent upwelling periods are starting earlier, happening more often, and lasting longer than they have historically; this exposes marine life to acidified, low oxygen waters more than in the past.
What are the trends in my region?

There are seven large marine ecosystems across the United States and 11 locations with ocean acidification indicators with multiple locations in Alaska.

Aleutian Islands, Alaska
- pH – between 10th and 90th percentile, recent downward trend
- pCO2 – above 90th percentile, recent upward trend
- Ωar – below 10th percentile, recent downward trend
Strong Recent Acidification Trend: This region shows a clear, significant upward trend in pCO2 meaning the ocean is currently absorbing CO2 faster than in the past. This rapid absorption mirrors a parallel decrease in pH (increasing acidity) and a drop in aragonite saturation, posing an increasing challenge for local marine life that build calcium carbonate shells and skeletons.

Gulf of Alaska
- pH – below 10th percentile, no trend information provided
- pCO2 – above 90th percentile, no trend information provided
- Ωar – between 10th and 90th percentile, recent downward trend
Elevated acidification, Stable Recent Trend: While pCO2 has not shown a significant recent trend, the values remain historically above normal, and pH values are concurrently below normal. This indicates increased acidity. The stability of the measures over the last five years is a mixed signal (Ωar shows a recent downward trend), but the underlying state remains more acidified, presenting a persistent challenge to sensitive ecosystems.

California Current
- pH – below 10th percentile, recent downward trend
- pCO2 – above 90th percentile, recent upward trend
- Ωar – between 10th and 90th percentile, recent downward trend
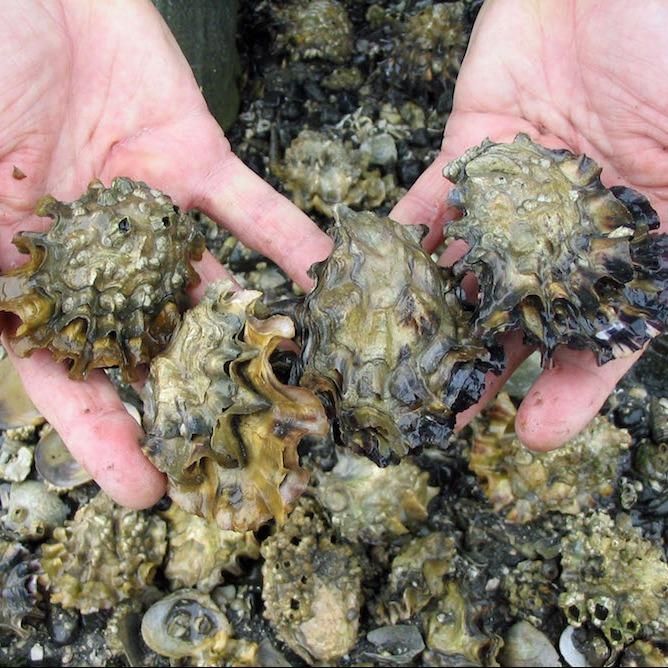
Regionally Exacerbated Acidification: As a region characterized by strong seasonal upwelling, this region is known for periods of intense acidification. When pCO2 levels are high, both pH and aragonite saturation are pushed into critically low ranges, which can directly impact plankton and economically important shellfish along the West Coast.

Caribbean
- pH – within 10th and 90th percentile, no trend
- pCO2 – within 10th and 90th percentile, recent upward trend
- Ωar – within 10th and 90th percentile, recent downward trend
Ongoing Coral Reef Stress: While long-term trends confirm overall acidification, the data in this region vary. When pCO2 is elevated, the primary consequence is a reduction in aragonite saturation seen in the recent upward trend in pCO2 and recent downward trend in Ωar, respectively. Since aragonite is the mineral used by coral reefs to grow and repair themselves, this low saturation state indicates increased stress on the foundation of this marine ecosystem.

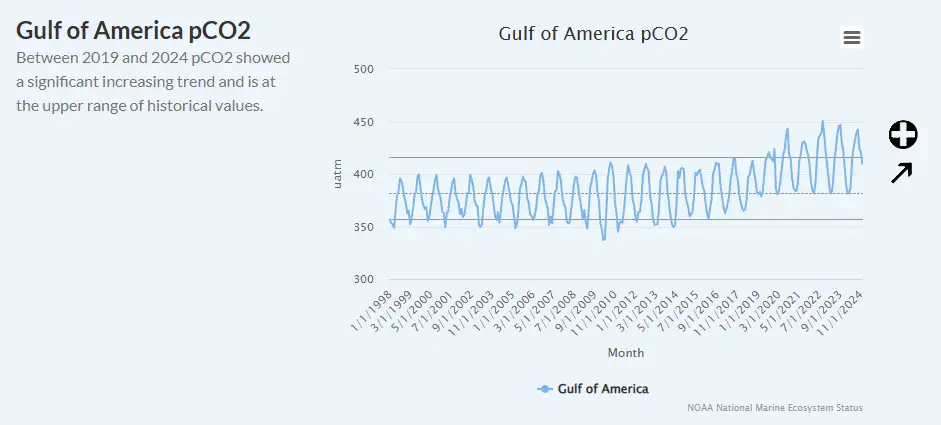
Gulf of America
- pH – below 10th percentile, recent downward trend
- pCO2 – above 90th percentile, recent upward trend
- Ωar – below 10th percentile, recent downward trend
Significant Acidification Trend: The Gulf of America shows a clear and significant increasing trend in pCO2, placing recent measurements at the upper end of the historical range, along with ongoing decrease in pH and decrease in aragonite availability. This strong, consistent signal across all three ocean acidification measures confirms the region’s acidification is increasing.

Hawai‘i & Pacific Islands
- pH – below 10th percentile, no trend
- pCO2 – above 90th percentile, recent upward trend
- Ωar – below 10th percentile, no trend
Stable Low pH: The pH in this open ocean-dominated region shows no significant recent trend, but remains consistently at the low end of its historical range. However, the pCO2 shows a recent upward trend and remains at the high end of the range of historical values. This region’s chemistry is less affected by coastal influences. The stability across pH and Ωar indicators points to a slow, steady change driven by the increase in global absorption of atmospheric pCO2.

Northeast U.S.
- pH – below 10th percentile, no trend
- pCO2 – above 90th percentile, recent upward trend
- Ωar – within 10th and 90th percentiles
Acidic Status, Mixed Stability: Recent pCO2 levels were consistently above historical averages, whereas pH has been consistently below. This indicates that seawater is currently more acidic than in the past. However, pCO2, pH and Ωar measures over the last five years show no significant trend, suggesting there is stability in the rate of change over the last five years, even as the overall status remains highly acidified.

Southeast U.S.
- pH – below 10th percentile, no trend
- pCO2 – above 90th percentile, recent upward trend
- Ωar – below 10th percentile, recent downward trend
Acidic Status, no significant trend in pH: The pH shows no significant recent trend despite increasing pCO2. However, pH consistently reports below historical averages over this five year period. While the rate of acidification has been stable over the last five years, the region is experiencing increased acidity. This is consistent with high and increasing pCO2 and low and decreasing Ωar relative to longer-term monitoring.
This is only a subset of the areas with ocean acidification indicators. Want to know more about the other areas and/or other indicators? Explore all the regional indicators including indicators for the Great Lakes.
What are sources of variation?

This dashboard shows how much more there is to the ocean acidification story than the global average ocean acidification numbers that are commonly reported. Geographic or seasonal variations may help explain why ocean acidification impacts certain ecosystems or species differently.
Physical and biological processes can cause changes in these indicators on local to regional scales. For example, temperature, windspeed, relative amounts of CO2 in the atmosphere and ocean, and watermass circulation can change pCO2, pH, and omega aragonite. Also, photosynthesis by marine plants, from tiny single-celled plankton to enormous macroalgae removes CO2 from the ocean, lowering pCO2 and raising pH. Respiration by any large collection of creatures from bacteria to marine mammals will measurably add CO2 to the ocean. Repeated seasonal cycles in the data come from the combined action of temperature, water circulation, and biological activity, hence the similar patterns observed across multiple regions.