


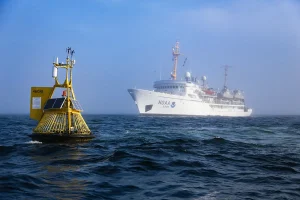
The East Coast Ocean Acidification Cruise (ECOA) is NOAA’s coastwide sampling of the region. The cruise provides high quality data for monitoring the carbon system along the U.S. East Coast and covers fishing grounds for the nation’s most valuable fisheries, potential siting for wind energy projects, and other important navigational and ecological areas. The climate quality information gleaned by cruises like ECOA help us track long-term ocean change and evaluate data from our monitoring network of buoys, gliders, and other tools.
Click the button below to access the Ocean Carbon and Acidification Data Portal and enter “ECOA” in the “Additional Terms” field.
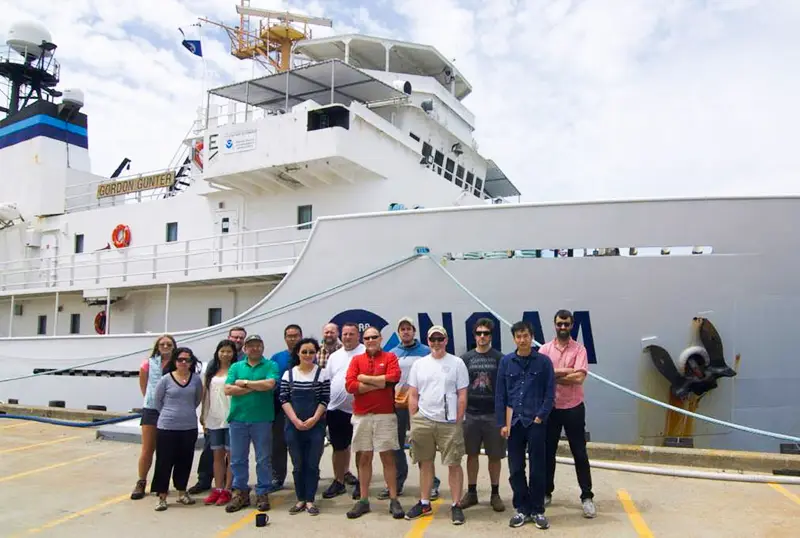
ECOA-4 is the fourth East Coast Ocean Acidification research mission. The mission provides high quality data for monitoring the carbon system along the U.S. East Coast and will cover fishing grounds for the nation’s most valuable fisheries. This mission not only monitors ocean chemistry, but also links marine biological and chemical processes, and improves our ability to model and forecast ocean change. The information gleaned by cruises like ECOA-4 help us track long-term ocean change and evaluate data from our monitoring network of buoys, gliders, and other tools. The cruise is led by scientists at the University of New Hampshire and joined through transdisciplinary partnerships with others from the University of Delaware, University of Miami Rosenstiel School of Marine, Atmospheric and Earth Science, NOAA labs, sanctuaries and programs and others that continue their work shoreside.
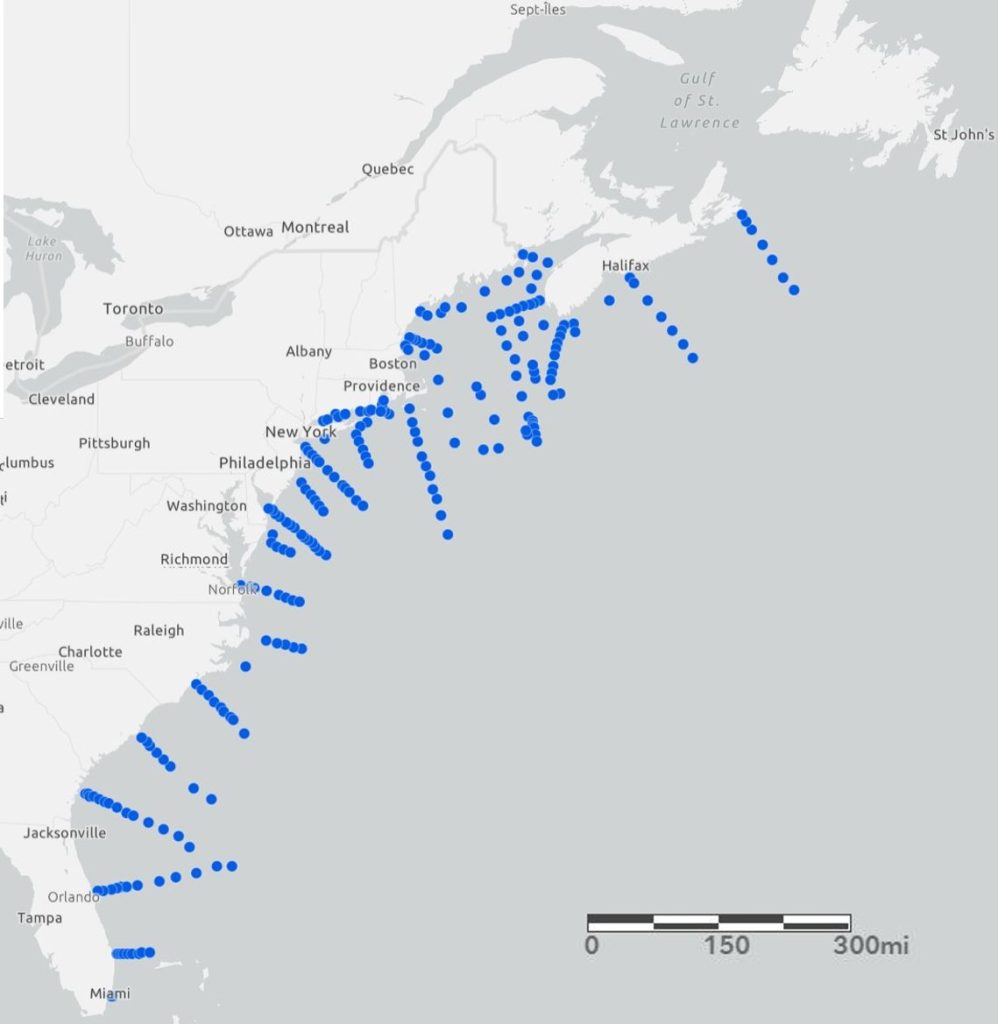
ECOA-3 is the third iteration of the East Coast Ocean Acidification Cruise and marks 15 years since the first NOAA coastwide sampling of the region. The cruise provides high quality data for monitoring the carbon system along the U.S. East Coast and will cover fishing grounds for the nation’s most valuable fisheries. This iteration not only monitors ocean chemistry, but also links marine biological and chemical processes, and improves our ability to model and forecast ocean change. The information gleaned by cruises like ECOA-3 help us track long-term ocean change and evaluate data from our monitoring network of buoys, gliders, and other tools. The cruise is led by scientists at the University of New Hampshire and joined through transdisciplinary partnerships with others from the University of Delaware, University of Connecticut, University of Miami, North Carolina State University, Lamont-Doherty Earth Observatory, NOAA and others that continue their work shoreside. Learn more about their research by hovering over the items on the map (above).
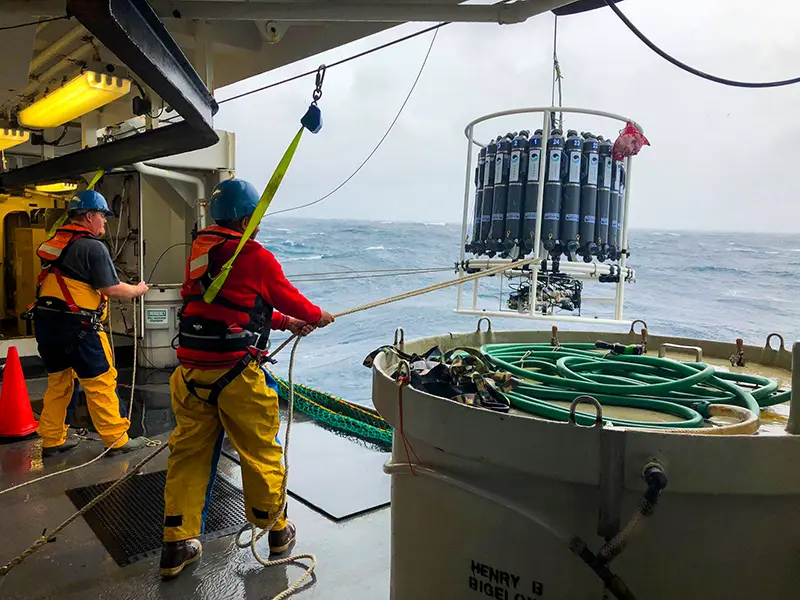
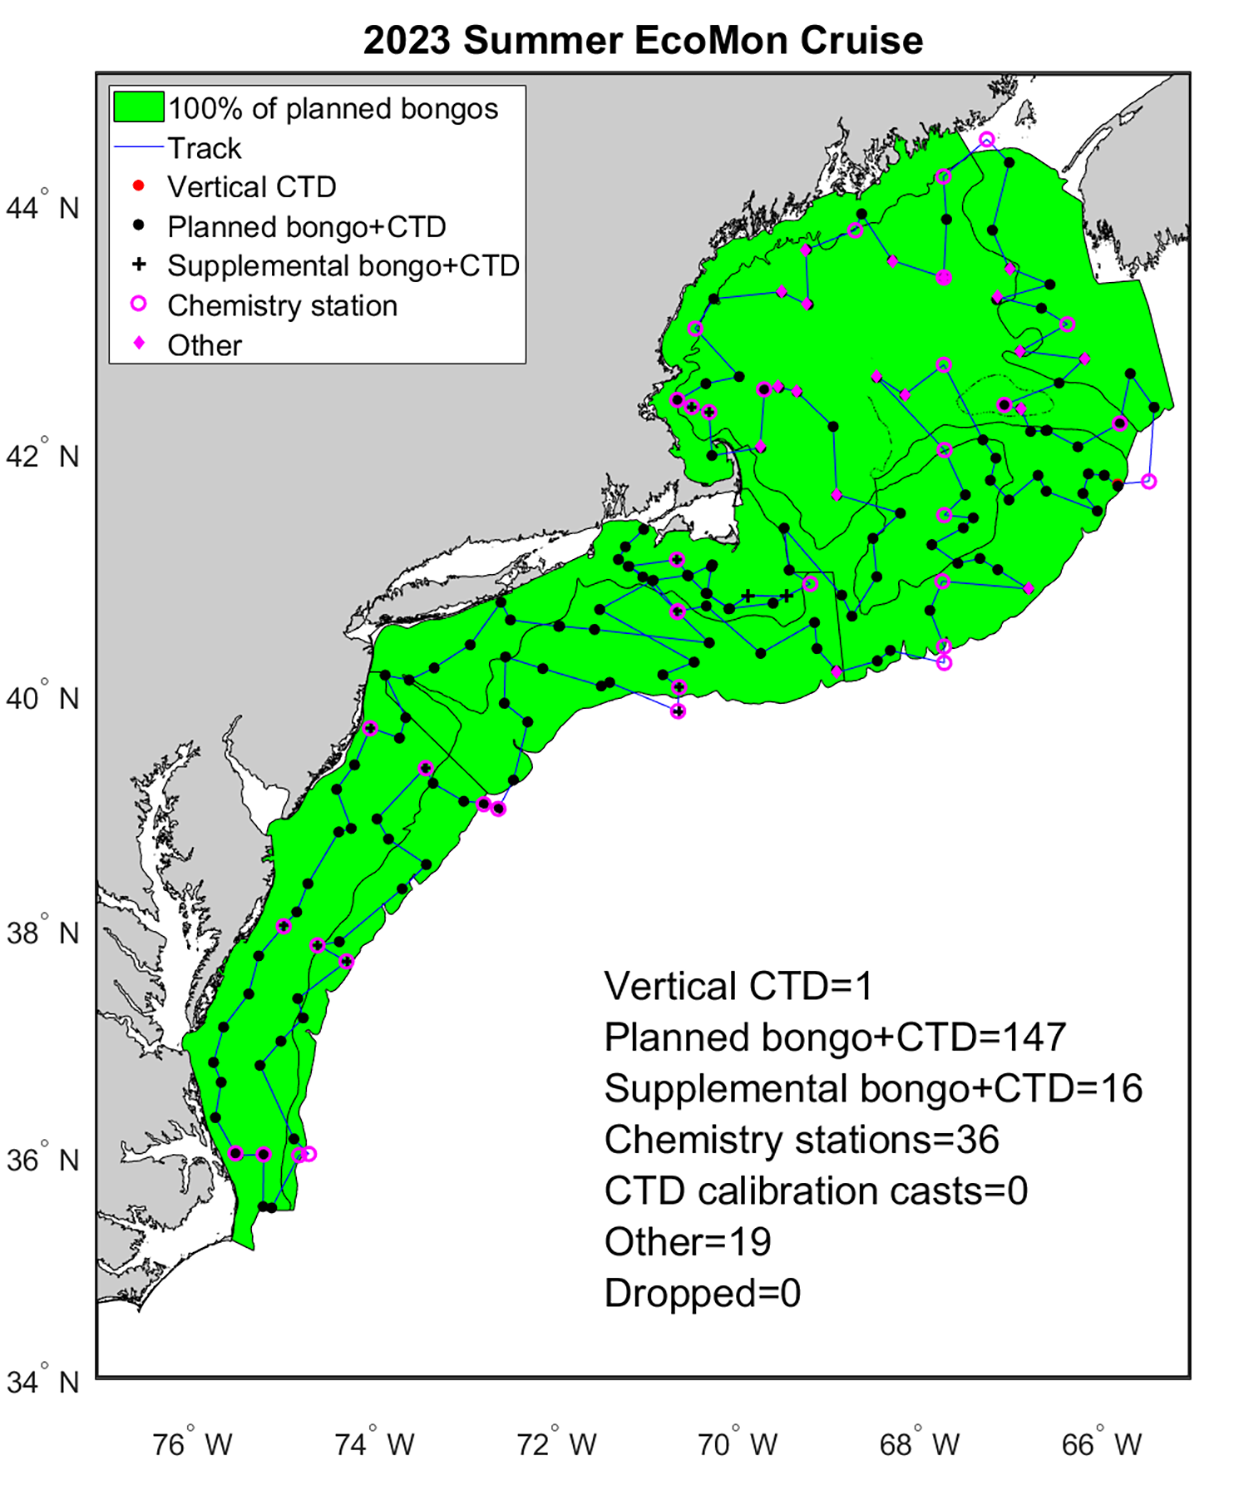
EcoMon is a NOAA Fisheries ecosystem monitoring cruise held quarterly in the northeast U.S. Through OAP support, carbon parameters are collected on EcoMon cruises alongside fisheries ecosystem metrics.
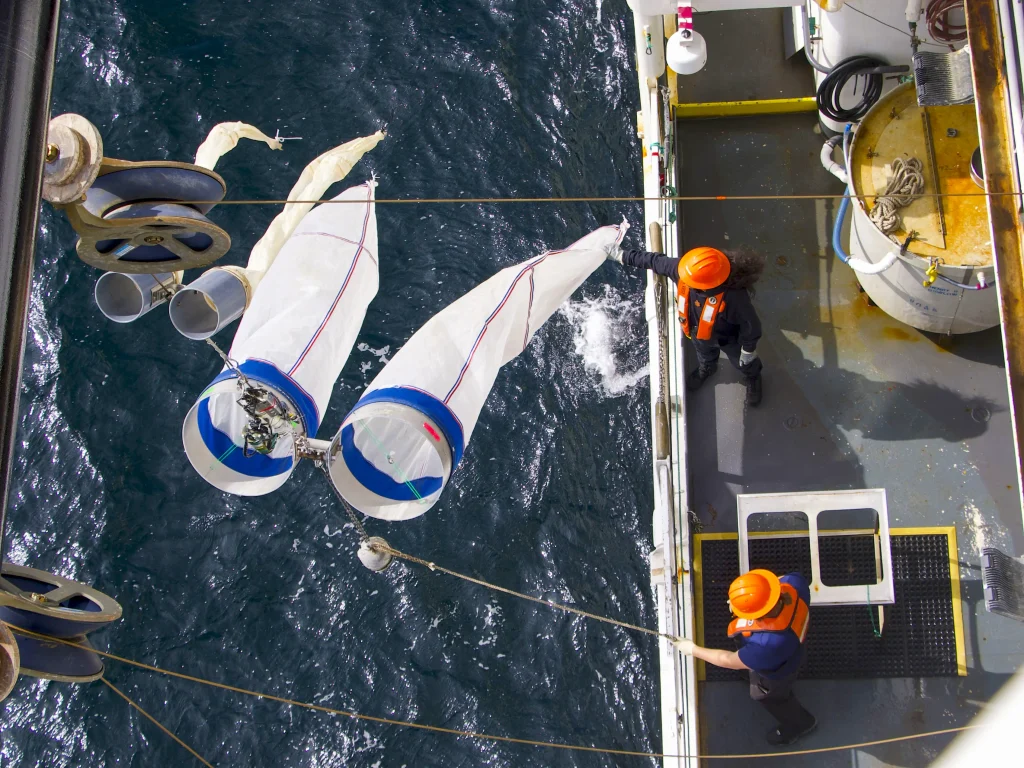
The EcoMon OA sampling occurs at 35 fixed stations which have remained consistent throughout the prior years of the survey. Stations are arranged in cross shelf transects from North Carolina to the Gulf of Maine, with additional stations at locations of interest dictated by oceanographic features such as the Northeast Channel in the Gulf of Maine, which serves as a conduit for source waters entering the region. At each station we sample surface, middle and bottom depths for total alkalinity (TA), dissolved inorganic carbon (DIC), and pH, alongside oceanographic profiles with conductivity (salinity), temperature depth (CTD) and dissolved oxygen sensors. The EcoMon surveys also perform oblique bongo net tows for zooplankton and ichthyoplankton with attached CTD instruments at ~130 stations. Starting in 2021, funded by NOAA OAP, the NEFSC has been subsampling pteropods from bongo nets for optical analysis of shell transparency as an indicator of biological OA exposure, using methods developed by Dr. Amy Maas at the Bermuda Institute of Ocean Science (BIOS).

Bioeconomic models are a multidisciplinary tool that use oceanography, fisheries science and social science to assess socioeconomic impacts. Funded by the Ocean Acidification Program, researchers at the Alaska Fisheries Science Center use a bioeconomic model to study the impacts of ocean acidification on Eastern Bering Sea crab, northern rock sole and Alaska cod. The goal is to predict how ocean acidification will affect abundance yields and income generated by the fisheries. This work informs the potential economic impacts of ocean acidification and future decision making and research planning.

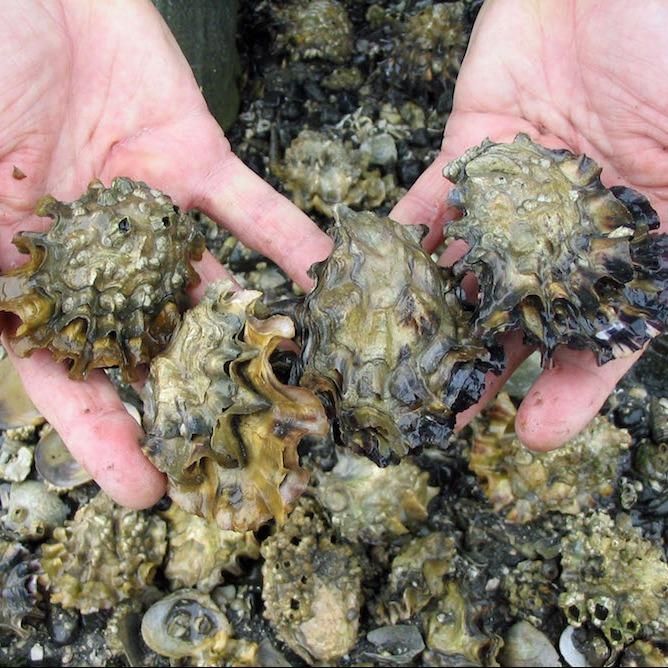
Long-term declines of red king crab in Bristol Bay, Alaska may be partially attributed to ocean acidification conditions. These impacts may be partially responsible for the fishery closures during the 2021–2022 and 2022–2023 seasons. Researchers found that ocean acidification negatively impacts Alaskan crabs generally by changing physiological processes, decreasing growth, increasing death rates and reducing shell thickness. Funded by the Ocean Acidification Program, scientists at the Alaska Fisheries Science Center continue to investigate the responses of early life history stages and study the potential of various Alaska crabs to acclimate to changing conditions. Results will inform models that will use the parameters studied to predict the effects of future ocean acidification on the populations of red king crab in Bristol Bay as well as on the fisheries that depend on them. Fishery managers will better be able to anticipate and manage stocks if changing ocean chemistry affects stock productivity and thus the maximum sustainable yield.

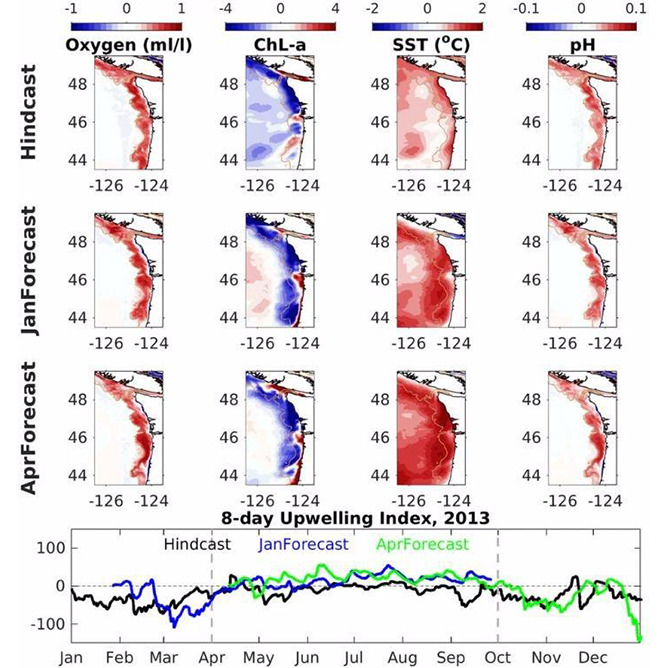
Understanding seasonal changes in ocean acidification in Alaskan waters and the potential impacts to the multi-billion-dollar fishery sector is a main priority. Through work funded by NOAA’s Ocean Acidification Program, the Pacific Marine Environmental Laboratory developed a model capable of depicting past ocean chemistry conditions for the Bering Sea and is now testing the ability of this model to forecast future conditions. This model is being used to develop an ocean acidification indicator provided to fisheries managers in the annual NOAA Eastern Bering Sea Ecosystem Status Report.
The NOAA Ocean Acidification Program (OAP) works to prepare society to adapt to the consequences of ocean acidification and conserve marine ecosystems as acidification occurs. Learn more about the human connections and adaptation strategies from these efforts.
Adaptation approaches fostered by the OAP include:
Using models and research to understand the sensitivity of organisms and ecosystems to ocean acidification to make predictions about the future, allowing communities and industries to prepare
Using these models and predictions as tools to facilitate management strategies that will protect marine resources and communities from future changes
Developing innovative tools to help monitor ocean acidification and mitigate changing ocean chemistry locally
Drive fuel-efficient vehicles or choose public transportation. Choose your bike or walk! Don't sit idle for more than 30 seconds. Keep your tires properly inflated.
Eat local- this helps cut down on production and transport! Reduce your meat and dairy. Compost to avoid food waste ending up in the landfill
Make energy-efficient choices for your appliances and lighting. Heat and cool efficiently! Change your air filters and program your thermostat, seal and insulate your home, and support clean energy sources
Reduce your use of fertilizers, Improve sewage treatment and run off, and Protect and restore coastal habitats
You've taken the first step to learn more about ocean acidification - why not spread this knowledge to your community?
Every community has their unique culture, economy and ecology and what’s at stake from ocean acidification may be different depending on where you live. As a community member, you can take a larger role in educating the public about ocean acidification. Creating awareness is the first step to taking action. As communities gain traction, neighboring regions that share marine resources can build larger coalitions to address ocean acidification. Here are some ideas to get started: