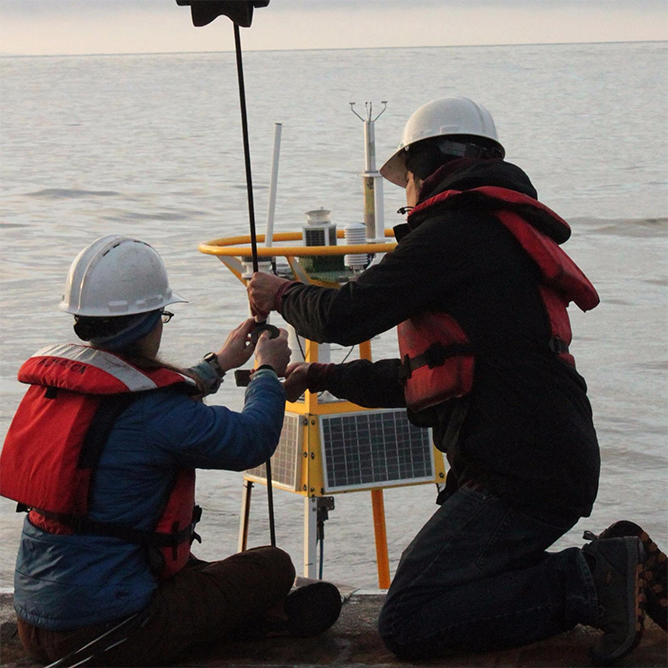
Global Ocean Acidification Observing Network (GOA-ON) Data Explorer
Global Ocean Acidification Observing Network (GOA-ON) Data Explorer Read More »
Websites with data related to ocean and coastal acidification or resources using data (ex: data-based educational resources).
A unified interface to access all ocean carbon dioxide data products. For more information, check out: Jiang et al. (2026)
Ocean Carbon Dioxide Products hub Read More »
An inquiry-based lesson where students investigate if ocean acidification and ocean warming affect the behavior and survival of stone crab larvae published in 2024. A full toolkit to be released in fall 2026.
Students examine data on Mid-Atlantic species to understand how decreasing pH affects growth, reproduction, and survival. They connect changes in chemistry to impacts on living organisms.
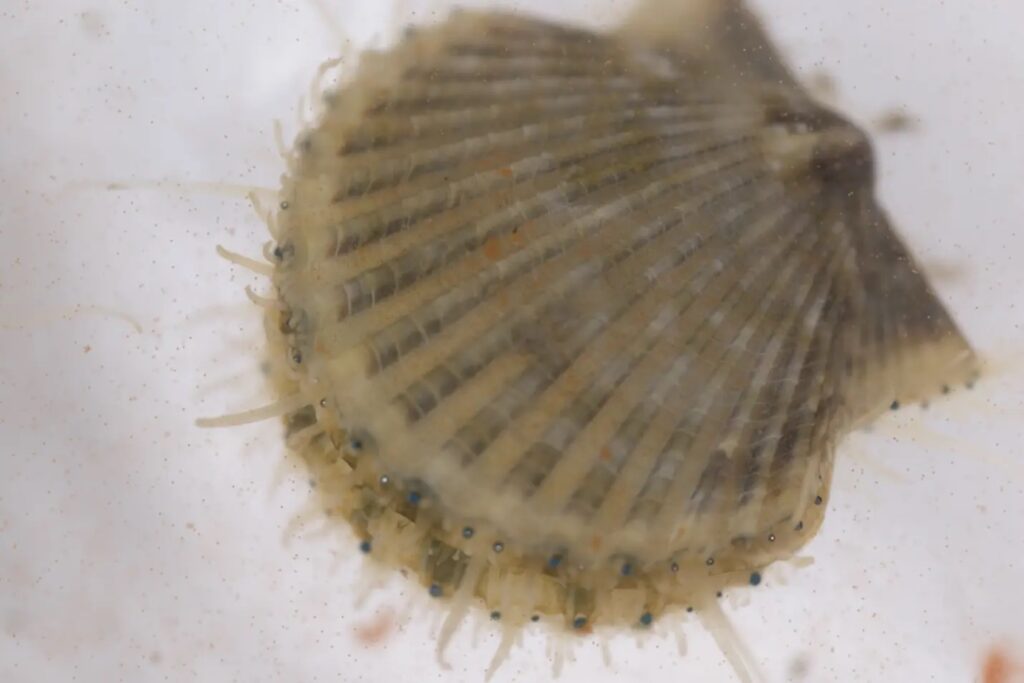
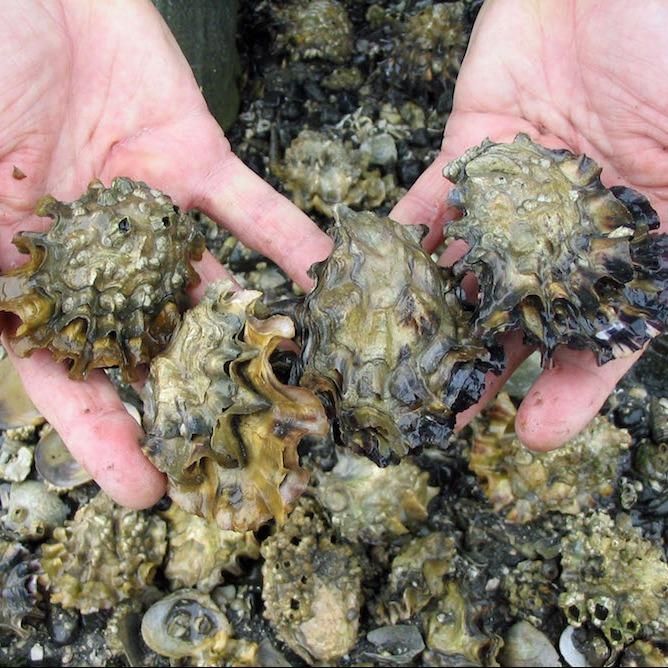
This lesson engages students in investigating declining bay scallop populations while exploring the scientific method and experimental design. Students analyze data, build critical thinking skills, and examine coastal acidification’s impacts on biological species. In Part 2, students apply the scientific method to investigate the bay scallop mystery by reviewing key steps, conducting research, developing hypotheses,
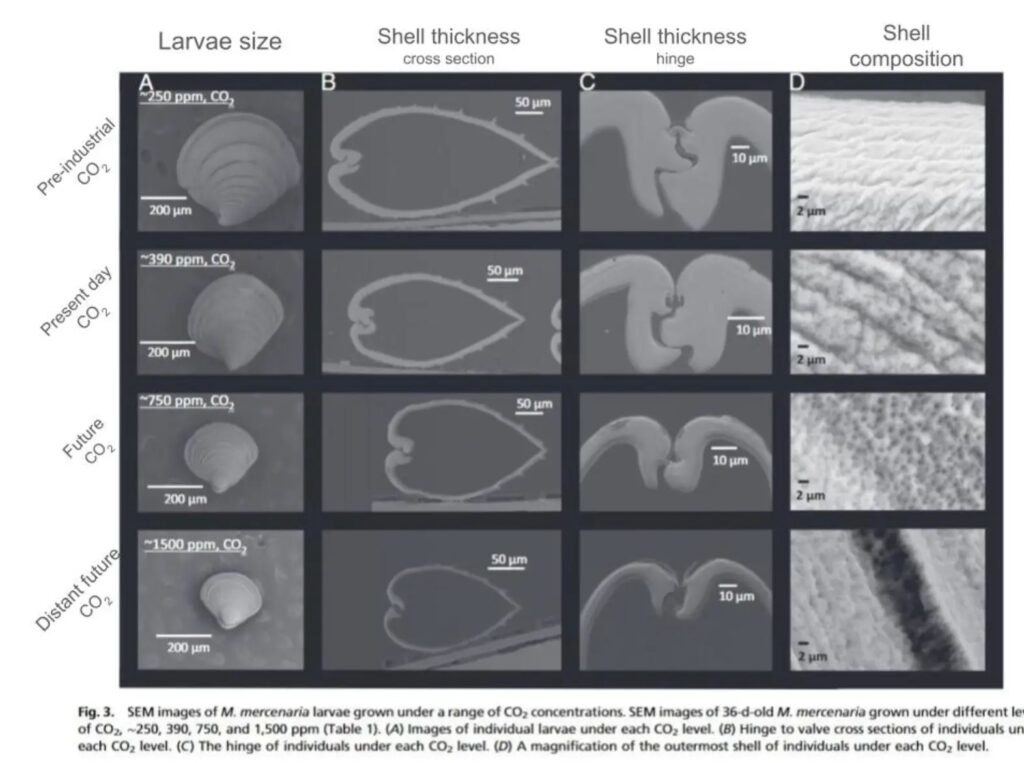
Students work individually and in groups to analyze data related to bivalve health. The lesson focuses on interpreting evidence and drawing conclusions about the effects of dissolved CO₂.
Dive into this explainer for the National Marine Ecosystem Status indicator for ocean acidification. NOAA’s National Marine Ecosystem Status website provides snapshots of major marine and Great Lakes ecosystem indicators, capturing both the status and trends of eight U.S. ecosystem regions and overall national status. The ocean acidification indicator dashboard uses long-term ocean observing data to provide snapshots on
OA Indicators Explained Read More »
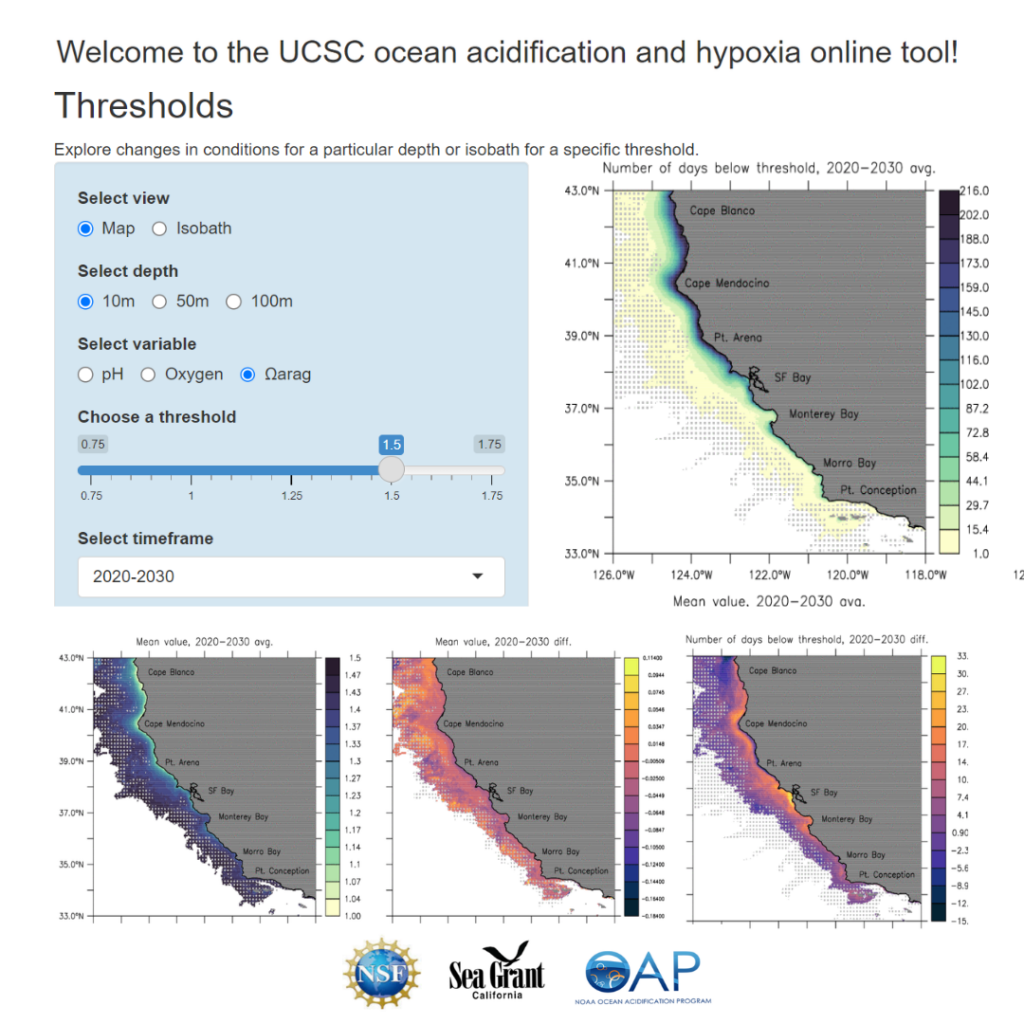
This interactive online tool developed by the University of California, Santa Cruz provides ocean acidification and hypoxia (OAH) projections for California coastal waters. This tool allows users to visualize the future progression of OAH at spatial scales relevant to marine resource management, and for biologically-relevant pH, aragonite saturation state, and oxygen thresholds.
Interactive ocean acidification and hypoxia tool for Coastal california Read More »
Chesapeake Bay, the largest estuary in the continental United States, has strong spatial gradients and high temporal variability in water conditions that are not easily captured by discrete (single timepoint) field measurements. This archive provides an atlas of physical and biogeochemical conditions for the Chesapeake Bay based on numerical model results of 1985-2023. The atlas
Chesapeake Bay Modeling Data Tool (1985-2023) Read More »
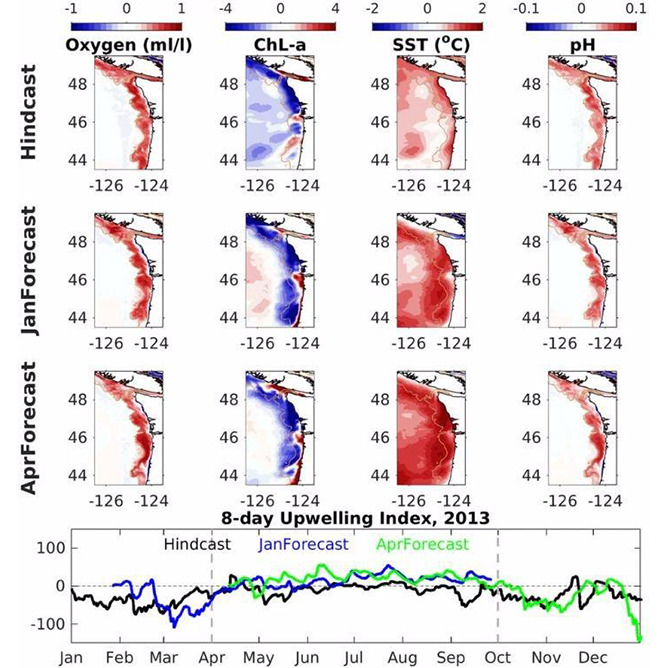
The NANOOS Visualization System (NVS) Shellfish Growers App provides shellfish growers and restoration managers with better and more ocean acidification and ocean condition information for decision making.
NANOOS Visualization System: Shellfish Growers App Read More »